No developer enjoys debugging web applications. But we all know that if we want quality software debugging is a crucial aspect of development. While .Net and Java developers often have IDEs that contain full debugging support, PHP developers may sometimes feel left out. Sure, there are quite a few commercial applications that help with debugging PHP. But these commercial applications are usually quite expensive and operating system dependent. Luckily there are a few open source tools out there that will give PHP developers the same debugging experience without the use of an expensive IDE.
Microsoft has recently released an open source code editor named Visual Studio Code. Visual Studio Code runs on Linux, Windows, and OSX and also features integrated debugging for almost any programming language. While Code does not feature out of the box debugging for all languages, extensions have been developed for most of the popular languages including PHP.
Installing Visual Studio Code
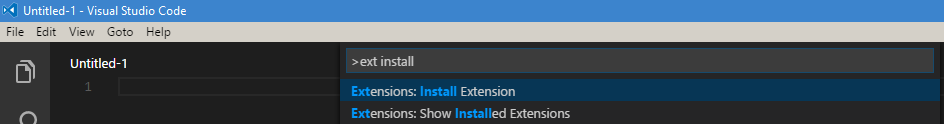
To get started first visit https://code.visualstudio.com to download and install Visual Studio Code. Once Code is installed and running you will need to install the PHP debugging extension. To do this, choose “View” on the toolbar and select “Command Palette”. In the drop down box type “ext install” and press enter.
Then type “PHP Debug” and choose the extension aptly named “PHP Debug” and press enter.
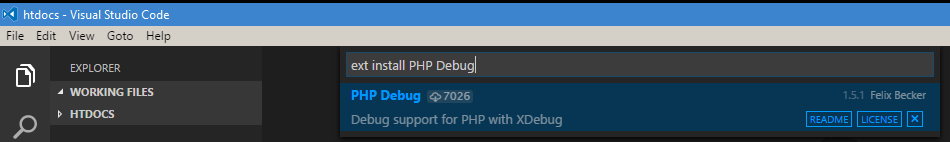
Once the debugging extension is installed Visual Studio Code will restart.
Installing Xdebug PHP extension
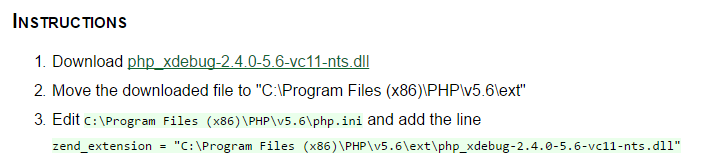
The next step is to install the Xdebug PHP extension. To do this visit https://xdebug.org/download.php and follow the instructions. If the downloading of these files and modification of your php.ini seems too daunting you can also visit https://xdebug.org/wizard.php. This wizard allows you to paste the contents of a phpinfo() call and it will then give you exact instructions on what files to download, where to place them, and what needs to be added to you php.ini file to install the extension correctly.
Visual Studio Code debugging setup
Now we need to setup Visual Studio Code to allow debugging. In Visual Studio Code, select “File” and then “Open Folder” and choose the folder containing your PHP code. Choose the Debug View from the left hand side and then click the Debug button to configure our debugging environment.
![]() (Debug View)
(Debug View) ![]() (Debug)
(Debug)
The first time the Debug button is selected it will create a debugging configuration file. For our purposes we can just leave it as is and not worry about it again. Click the Debug button again and if everything is setup correctly Visual Studio Code will now be in debugging mode!
Debugging! Finally!
For the debugger to be useful we now need to add some breakpoints in our code. To create a breakpoint simply click in the gutter next the line you want to create a breakpoint on.
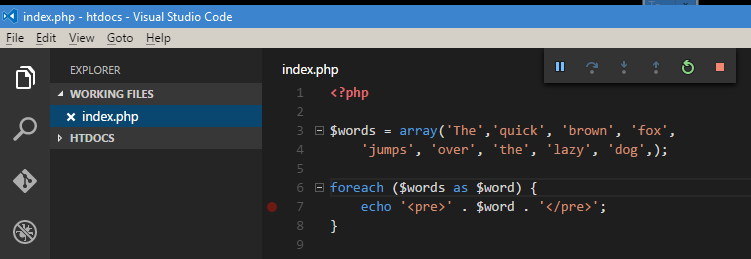
Like most debuggers, breakpoints in Visual Studio Code are indicated by a red dot. If we now load the page in the browser the execution of the page will stop at our breakpoint and we can inspect the current state of the page.
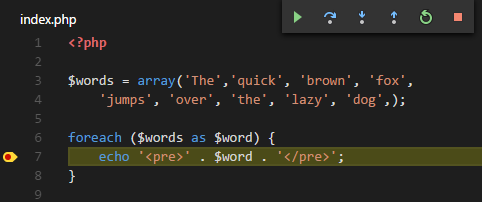
(Paused at breakpoint)
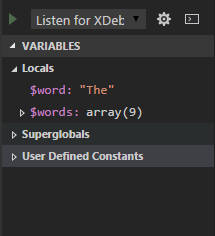
(Local and global variables)
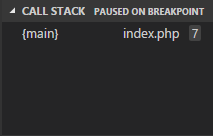
(Call stack)
This is a trivial example but it shows some of the debugging tools available for PHP in Visual Studio Code. The setup may seem a little complex but just remember that it only has to be done once. And the time spent in setup will more than be saved when it comes to time to debug your code. Happy debugging!